
Geotec offers a variety of geophysical surveys for the entire range of needs in this field. The company's professional and experienced personnel combines hardware and software capabilities in a multidisciplinary manner.
Our surveys include the use of different methods:
Ground Penetrating Radar (radar) - GPR
general
method
Advantages and limitations
applications
equipment
|
· Method A. The ground penetrating radar system is based on transmitting electromagnetic waves to the desired medium (soil, concrete, etc.) and absorbing the waves that are returned back to the surface. B. The method is sensitive to changes in the electrical properties of different materials in the subsoil (ie, the dielectric and the electrical conductivity). The electrical characteristics of the soil depend on the type and structure of the material and the water content. third. When there is a contrast in the dielectric properties of different materials, some of the electromagnetic energy will be returned back. D. In order to map the subsoil, measure the amplitude and time of the waves being returned. God. The electromagnetic waves are transmitted by an antenna in the central frequency range, and are captured back by the same antenna (mono-static system) or alternatively a separate antenna (a bi-static system). There are radar systems capable of operating several broadcasting and receiving antennas. and. The frequency of the transmitted waves is selected according to the size and depth of the desired target. G. There is an inverse relationship between depth and frequency; The lower the transmission frequency, the greater the penetration depth at low resolution and vice versa, high frequency transmission allows penetration to a more shallow depth and higher resolution. H. The radars range from 25 MHz to 2.5 GHz. ninth. At the end of the radar survey, a series of subsurface sections (parallel to the seismic section) are presented, presented in terms of time versus horizontal distance. Time is actually the time of the wave transition in the soil back and forth from the target (TWTT). Y. The speed of the radar wave in the air is the speed of the light (0.2998 mTrannoshenia), its velocity in any other medium is lower, the water will be the lowest velocity. The velocity of the electromagnetic wave in the medium depends on the dielectric constant of the medium.
|
||||||||||||||||||||||||||||||||||||
Seismic surveys
A seismic survey is based on an energy source that generates excitation of seismic waves in the subsurface. The seismic waves propagate in the subsurface and are either refracted or fractured in the transition zones between a medium of one seismic velocity and a medium with a different seismic velocity. The incoming waves are absorbed into the surface by a set of geophones. Measuring the transition time of the seismic waves from the source to the receptors, and the geometry of the receiver and source array, allow information to be processed and decoded into the subterranean image. We offer a variety of measurements using different seismic methods. Geotek performs a variety of seismic measurements:
Refraction The refraction is based on the principle that a seismic wave that hits the boundary between two layers in which there is a contrast at the seismic speeds (and in fact impedance, impedance, which multiplies the velocity of progress in the medium in its density) will change the direction of its expansion as it enters the new layer. The magnitude of the change in the wave propagation direction depends on the contrast ratio between the velocities under the Snell Act.The basic condition for refraction is that the velocity of the bottom layer will always be greater than that above it.
Tomographic refraction for the distribution of seismic velocities in the subsurface.
Reflection The reflection method is based on the principle that the seismic wave hits the boundary between two layers of contrast in the seismic impedance (as mentioned, the speed multiplier in density). The wave is returned from the above boundary to the receptors on the surface.
Surveys with surface waves Measurements of velocity and dispersion of space waves. This method enables the active measurement of Rayleigh and Lobe surface waves, including a complex procedure to obtain the one-dimensional cut of the vertical shear wave velocities SV and the horizontal SH and the thickness of the layers. From multiple measurements and from such a set of measurements, two and three-dimensional surveys can be obtained. Measurement in time axis also allows the fourth dimension.
Drilling and drilling surveys are measured using dedicated drilling equipment (source or receptor) and surface or borehole measurements. Tomographic measurements between drills, measurements UPHOLE, DOWNHOLE, CROSSBOREHOLE, VSP. Tomographic measurements between drilling and surface or underground installations (tunnels, etc.).
Measurements of surface waves, pressure waves and shear waves
Electromagnetic surveys
general
method
applications
general
Electromagnetic methods
The electromagnetic methods (FDEM, TDEM) were developed for the measurement of electrical resistance in the subsurface. These methods are used worldwide to solve engineering problems and environmental problems. Measurements in these methods can penetrate relatively large depths (up to hundreds of meters), with very high accuracy of data. In Israel, electromagnetic methods are known mainly for monitoring changes in salinity in groundwater and in the detection of metals. The electromagnetic equipment is easy to carry and operate, and measurements can be decoded relatively quickly.
method-
Electromagnetic methods (EM methods) are used in the fields of environment, geology and archeology, and in recent years - agriculture. These methods were developed to measure the electrical conductivity of the subsoil. Because the electrical conductivity changes as the composition of the medium changes, for example, water and mineral content, cavities, cracks and other parameters, a distribution map of the electrical conductivity in the subsurface can be obtained.The methods are based on magnetic inspiration and do not require direct contact with soil, making field work easier.
Electromagnetic methods were developed for the first time in the 1920s in Scandinavia, the United States, and Canada as methods for mapping metal deposits Until the 1960s, measurements were made using EM instruments by continuous transmission and reception at one frequency, , And receive multiple sensors at the same time to enable a deep cross-section of the measured soil properties to be replicated EM systems that transmit and receive at the same time, allowing for a deep cut by changing the frequency of the work, are called FEM-Frequency Domain ElectroMaegnetic systems, In the Soviet Union) to build the receiving systems This approach has been gaining momentum since the 1970s, and EM systems that measure the change in value measured in time are called TEM, TDEM Time Domain ElectroMagnetic, and the main advantage of this method is that the signal received is the ground response only, without The primary electromagnetic field disturbance transmitted by the instrument.
Frequency modulation methods (FDEM)
FDEMs typically operate at frequencies of tens of Hertz to tens of kiloshertz, and are used for surveys in a wide range of depths and targets in the shallow subsoil. The measurement is done on lines (usually parallel), when several lines of measurement are performed parallel to the surface coverage. The final product is electrical conductivity maps, which show different phenomena in the subsoil. When using a device that operates at one frequency and away from it is a fixed transceiver, the reading received by the instrument is an integral of the measured medium, that is, reading an instrument represents an average conductivity of a medium, which is usually heterogeneous. When the device has multiple working frequencies, or when the distance varies between receiver and transmitter, the device can "see" different depths, and the depth cut can be reconstructed with inversion software. The permeability of FDEM devices is usually limited to shallow depths of several meters to several tens of meters. On the other hand, these devices, in comparison to other methods, enable fast data acquisition and coverage of large areas in a short period of time, and are therefore inexpensive to operate.
FDEM devices include a transmitter coil and a receiver coil at a distance from each other. The coils may be connected at a fixed or separate distance so that the distance between them can be changed. The transmitting coil (transmitter) continuously transmits and creates a variable magnetic field, which creates an electrical current in the soil. The electrical current in the soil creates a secondary magnetic field whose intensity is a function of the electrical conductivity of the soil. The receiver receives the secondary magnetic field, compares it to the primary field, and extracts the electrical conductivity from the ratio between the primary and secondary fields (Fig. 1).
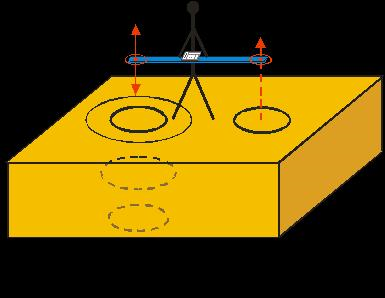
Figure 1. Schema describing the operation of the instrument in a homogeneous half-space.
The device can be carried in two ways. (Fig. 2), then the transmitter coils (Tx) and the receiver (Rx) are horizontal and the vertical (vertical) field is vertical. This mode is called a vertical mode. Option 2 When the device is tilted on its side, the transmitter and receiver coils are vertical and the horizontal field is horizontal.The second operating mode is called a horizontal mode. The penetration depth in horizontal mode is about half that of a vertical mod. In addition, a horizontal field is less sensitive to horizontal changes than a vertical field (Goldstein et al., 1990)
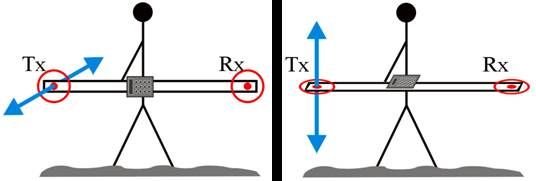
Figure 2. Right: vertical vertical vertical field (blue), transmitter coils and horizontal receiver. Left: Horizontal horizontal field, vertical coils of transmitter and receiver.
Methods that work in time domain (TDEM)
These methods are based on an energy source that generates an electrical alternating current (usually a step function) in a large source current loop (Fig. 3).The initial current in the source is created by the Bio-Sever Act, an initial magnetic field around the source current loop. The transmitter (connected to the power source and the power loop) stops the source current and resumes at a certain rate. In fact, the current waveform is composed of repeated interruptions and repetitions of the source current. 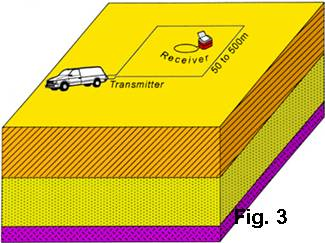
The sudden and sharp discontinuation of the current creates, according to Farday's Inheritance Law, an electromotive force (EMC) because of the change in the initial magnetic field flux. These currents depend on their intensity at any time (depth), in the electrical resistance of the subsurface. The currents diffuse diffusively into the ground, and the longer the time elapses the source current, the deeper the penetration, which contains deeper information. The submerged secondary currents create a secondary magnetic field that varies in time. The change in the secondary magnetic field in time creates EM (voltage) measured in the receiver's coil, which is measured in the absence of the initial magnetic field, and the information from the depth depends on the measurement time that elapsed after the source flow was stopped.
The TDEM method can be divided into two basic data collection methods :
Profiling - which is used to collect the distribution of electrical resistance in a lateral manner in order to identify anomalies along the survey line.
Sounding - vertical measurement (depth measurements). A method that measures the changes of electrical resistance with depth and is considered, in this respect, for drilling.
With the central loop method, the transmitter loop is a square shape (sometimes also a rectangle) whose length is tens to hundreds of meters, depending on the depth of the target and the required resolution. A series of points can be measured, creating a deep section of electrical conductivity (Fig. 4). Today there are TDEM systems operating at very shallow depth, and some are used for metal detection. The systems are small and can be operated by a single person. 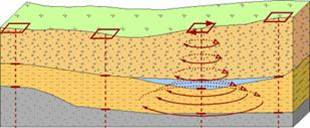
Figure 4. Number of TDEM measurements that generate an electrical conductivity section depicting the subterranean structure.
Sources:
• Ronen Amit, January 1991; Mapping the penetration of seawater into the coastal aquifer in Israel (the intermediate aspect) using the TDEM method.Department of Geophysics and Planetary Sciences.
applications
Hydrology Detection of saline water penetration, mapping groundwater
Infrastructure Detection of metals, pipes and burial infrastructure
Precise farming Mapping soil composition and land salinity for optimal fertilization and crop improvement
Archeology Locating cavities, caves and buried structures. Mapping the boundaries of archaeological sites
Environment Leak detection Leaks waste and water and fuel reservoirs
Geology Geological structure of the shallow incision and detection of mineral deposits
Geochemical surveys
general
method
applications
general
Electrical resistance - single / two / three dimensional imaging - VES, CVES, ERT
VES-Vertical Electrical Sounding (VES) is one of the oldest geophysical methods. This old method was improved during the late 1980s and early 1990s by an electrical imaging method for mapping the distribution of resistances in the subsoil. The electrical resistance method enables imaging in two or three CVES-Continuous Vertical Electrical Sounding or ERT-Electrical Resistance Tomography. The method is useful for mapping the shallow part of the subsoil at good resolution. Its obvious advantage is its indifference to the electromagnetic noise of the urban environment.
method
The electrical resistance method (VES) developed in the early 20th century thanks to the work of the Schlumberger brothers, who sought to investigate the distribution of electrical resistance of the subsoil with depth. Direct current (DC) is inserted into the ground through a pair of AB current electrodes and the potential difference generated in the ground is measured between a pair of potential electrodes MN. There are a variety of electrode diffusion patterns (Fig. 1), each of which can be used to study the distribution of electrical resistances in the subsoil as a function of depth or lateral spread. Sounding is performed by increasing the intervals between the electrodes systematically, around a preset center point. Profiling for profiling uses a longitudinal profile by fixing the spacing and moving the entire array along a specific line in the field.
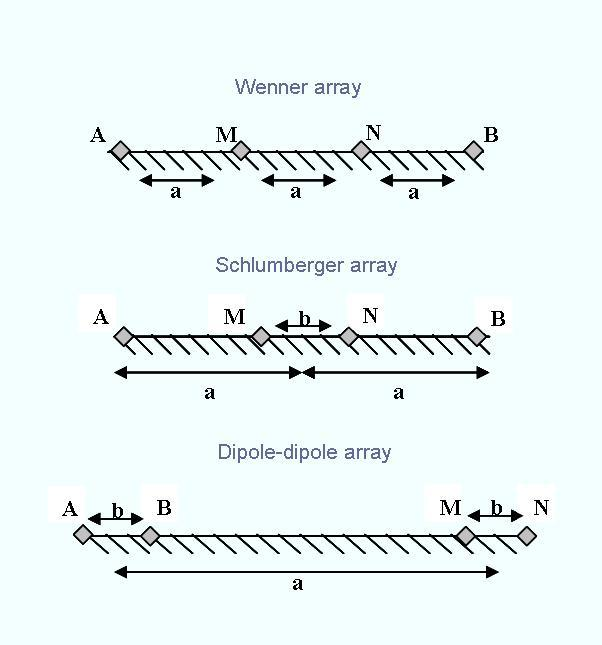
Figure 1. Top, Wenner array where the intervals between the electrodes are equal. In the middle, the Schlumberger array is characterized by intervals between the current electrodes that are at least three times greater than the potential electrodes. Down, Dipol-dipol array where there is a significant distance between the potential electrodes and the current electrodes.
The penetration depth of the method is a function of the spacing between the current electrodes and the potential electrodes and therefore varies depending on how the electrodes are deployed in the area. The varied modes of deployment of the electrodes meet the different needs of the structure of the soil under study and the level of background noise. For example, the Wenner array is advantageous in areas with high background noise, good resolution but shallow depths. In contrast, the Schlumberger array has a weaker signal but penetrates deeper.
From the outset, electric potential is measured in the ground and converted to electrical resistance using ohm law (where E is the potential cascade, J is the current density and R is the electrical resistance). This resistance is a function of the distance between the electrodes and is adjusted to each array by multiplying in a geometric constant, . It is called this because it represents an average of objections of all strata in the studied medium. Each of the imaginary resistance values is presented on a logarithmic graph against the distance between the electrodes. The calculation of the real electrical resistances of the strata out of the imaginary involves a model of the structure of the studied soil and its comparison to the logarithmic graph derived from the data. This process is performed using advanced software (Resix etc.) using Inversion (Figure 2).
One of the drawbacks of this method is the acceptance of equivalent solutions, that is, multiple solutions to the same data. The decoding model is not unique and it is possible to obtain several models, which may differ significantly from each other.
Continuous Vertical Electrical Sounding - CVES (this is the same as ERT )
In order to obtain a more precise model of the subsurface, a VES (vertical depth cutter), such as VES, will take into consideration a range of 25 electrodes or more, connected to a multi-channel cable, (Figure 3). The resulting result is a two-dimensional section that better describes the distribution of resistances in the subsoil (Figure 4).
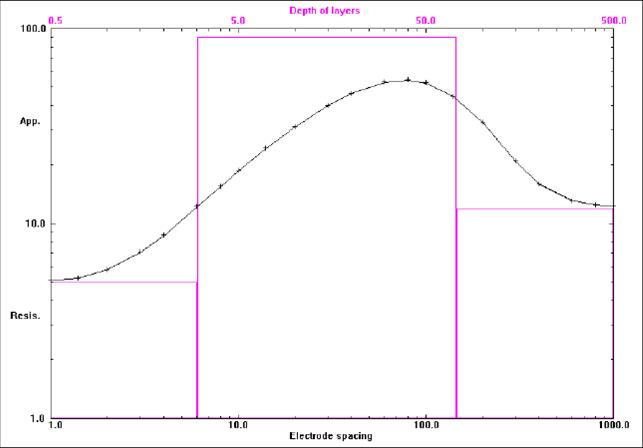
Figure 2. A typical one-dimensional data decoding model for the Wenner array. Pink color, a calculated model. The + sign indicates the false resistance data obtained in the measurement. A continuous black line represents the calculated imaginary resistance. (After Loke, 2004).
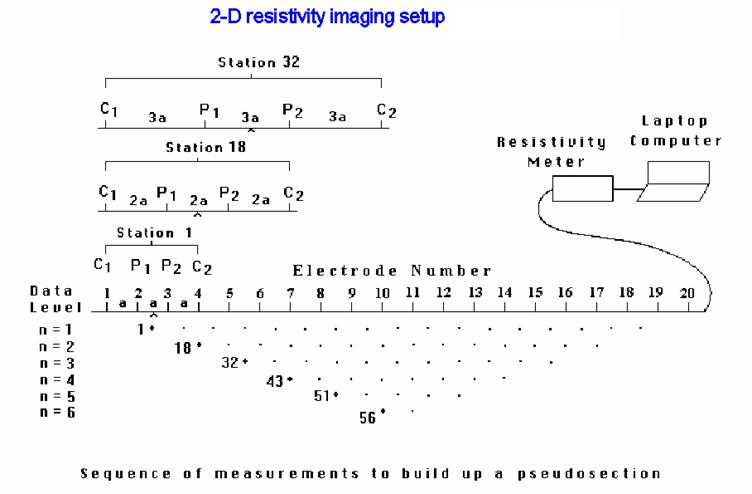
Figure 3. Placement of the electrodes in the CVES survey and the assemblage of the measurements used to construct the imaginary incision. Multiplying the interval between the electrodes (a) by 3, gives a measurement at a level (n = 3) deeper than its predecessors. (After Loke 2004)
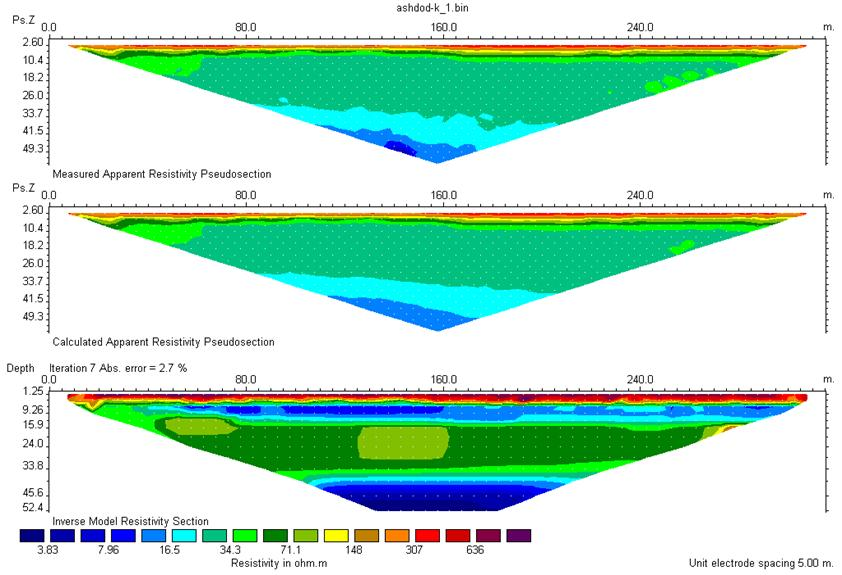
Fig. 4. Section on Ashdod beach. Top incision is simulated and measured resistance. In the middle, a pseudo-pseudo-pseudo-section is calculated to be built on the basis of the data. Below he cut real objections that he thought of inversion. At a depth of 40 meters, a layer of ground water is visible. (After Avivi, 2005)
Sources :
Aviv, T., 2005. Mapping of sea water penetration into the coastal aquifer using CVES measurements. Thesis, Tel Aviv University. (The data were collected by the staff of the Geophysical Institute of Israel, under the direction of Dr. Mark Goldman).
Loke.MH, 2004. Tutorial: 2-D and 3-D electrical imaging surveys.
applications
Environment: Detection and mapping of the movement of liquids / pollutants in the subsoil from fuel tanks and waste disposal sites and locating and mapping the penetration of salty water into groundwater.
Civil Engineering: Locating and mapping air space
Geology: Mapping shallow geological structure
Geotec Engineering & Environmental Geophysics Ltd.
Seeing beyond..
 עברית
עברית English